Object Grounding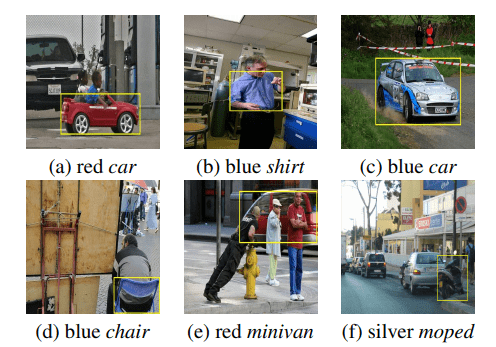
Object grounding refers to localize entities referred by the given natural language phrases. This requires associating words and phrases from language modality to objects and relations in the visual modality. This task is a challenging problem due to significant variations in objects and descriptive queries, which requires the model to understand both language and image as well as the relationship between them. We made progress in object grounding and achieved the state-of-the-art performances for both image and video object grounding on different settings with models named LSEP (WACV2021), ZSG-Net (ICCV2019) and VOG-Net (CVPR 2020).
Learning with Less Labels
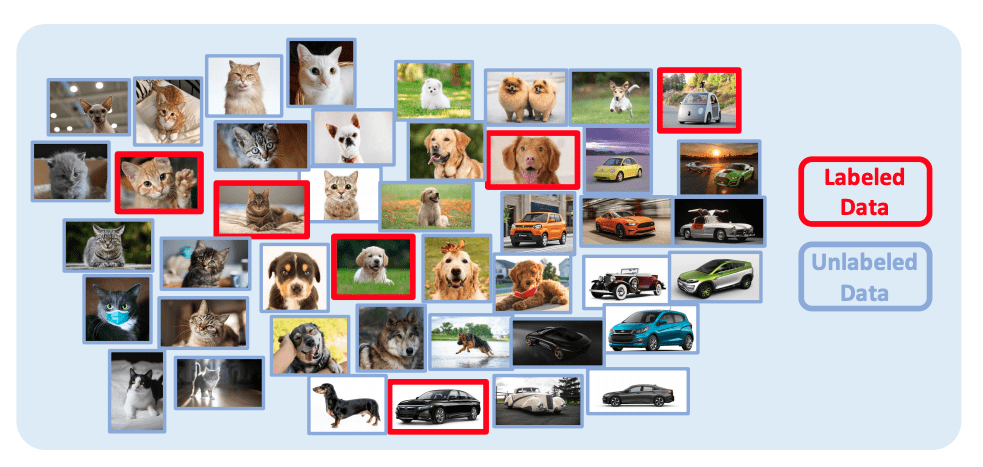
Deep neuron networks typically requires large amount of data for training to achieve good performance. However, it is challenging to obtain fully annotated datasets for every task. Meanwhile, human typically does not require hundreds of guided examples to learn new concepts. With the structured knowledge and recognition systems, we typically only need very limited amount of new knowledge to learn a concept. Many techniques have been developed to address this problem, include but not limit to few-shot learning, semi-supervised learning, self-supervised learning, unsupervised learning, continuous learning and domain adaptation. We have developed SimPLE (CVPR2021) that achieves the state-of-art performance in semi-supervised learning.
Media Forensics Detection
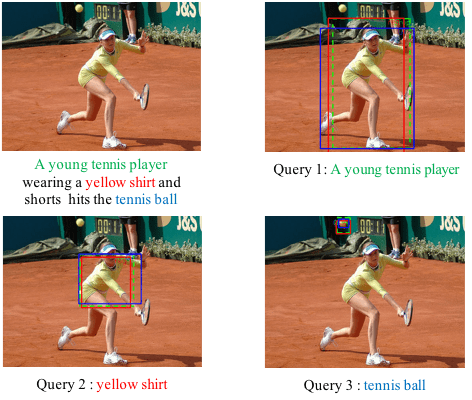
In this project, we focus on finding the semantic inconsistency between visual and language modalities. Specifically, we are actively working on the phrase grounding problem: Given a textual description of an image, phrase grounding localizes objects in the image referred by query phrases in the description. Compared to previous methods, we leverage context information as well as external knowledge to further boost phrase grounding system’s performance. In supervised and unsupervised scenarios, we have both achieved the state-of-the-art performance, which are named as MSRC (ICMR17), QRC-Net (ICCV17), KAC-Net (CVPR18) and SPAN (ECCV2020) respectively.
Video Temporal Analysis
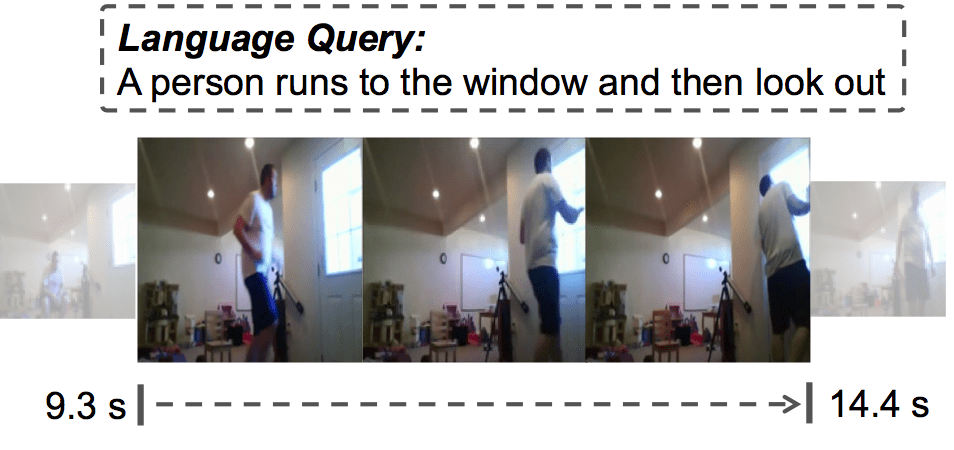
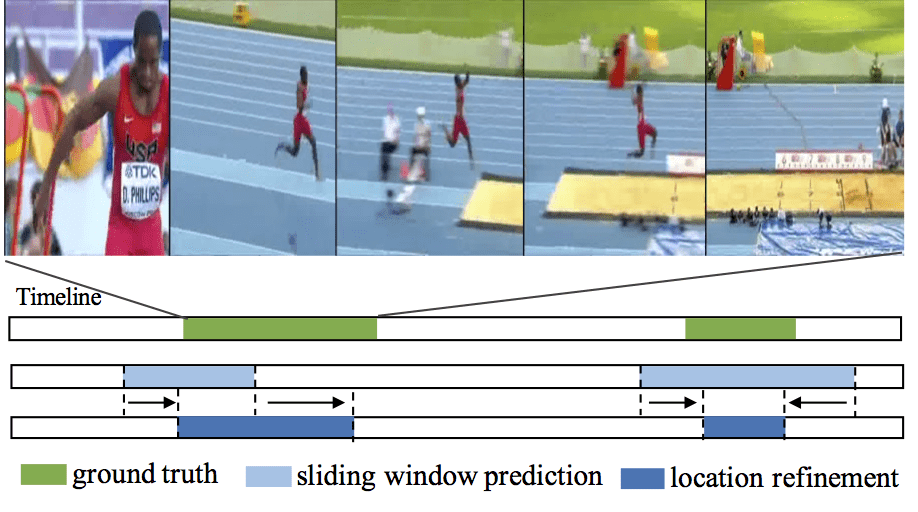
Capturing and sharing videos has become much easier since the development of mobile phones and internet, and the demand for semantic analysis of user generated videos is fast growing. Videos, different from images, introduce a unique dimension: time. Thus, in the video domain, temporal analysis is an important research directions and has many exciting topics, such as temporal activity detection(TURN, ICCV2017; CBR, BMVC2017), language-based video search (TALL, ICCV2017), action anticipation(RED, BMVC2017), video-based question answering(Co-Memory, CVPR2018) and so on. Temporal perception and reasoning in large-scale videos is a difficult problem, one has to tackle many challenges, such as complex temporal structures in videos, large video variation and large problem scale.
Face Recognition
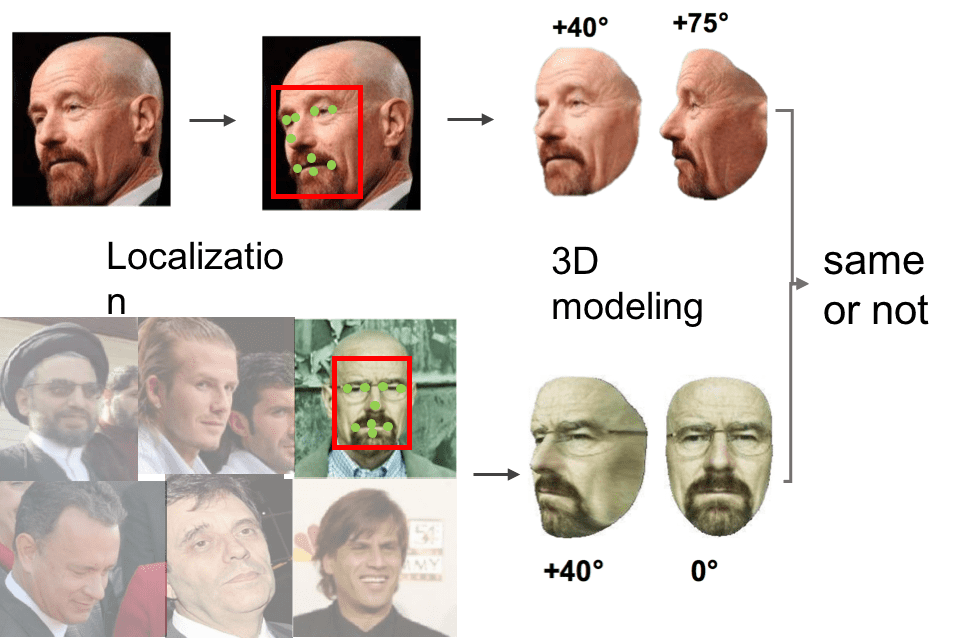
Unconstrained face recognition in the wild is a fundamental problem in computer vision. It aims at matching any face in static images or videos with faces of interest (gallery set). This task is a challenging problem due to large variations in face scales, poses, illumination and blurry faces in videos. A systematic pipeline is required, involving different tasks. We have made progresses in face detection and landmark localization (CVPR2017, BMVC2017), 3D face modeling(CVPR2017), face representation and classification (TPAMI2018, CVPR2016). With this pipeline, we have achieved state-of-the-art performance on challenging IJB-A benchmark.
Unsupervised 3D Geometry Learning

Learning to estimate 3D geometry in a single image by watching unlabeled videos via deep convolutional network has attracted significant attention recently. It can be applied to many real-world applications, including autonomous driving, navigation and robotics. This task is challenging as estimating 3D geometry from monocular single image is an ill-posed problem and only unlabeled monocular videos are available for training. We propose to learn different 3D visual cues jointly in an unsupervised method. The framework takes monocular videos as training samples and estimates three 3D information (depth, surface normal, geometrical edges) on monocular single image. Details are presented in published papers, (CVPR2018, AAAI2018). We have achieved state-of-the-art performances on KITTI 2015 and Cityscapes datasets.